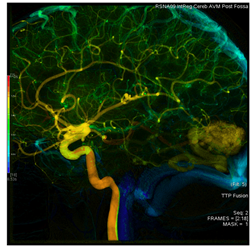
AngioViz uses peak time and density with color as time, and peak density as brightness to show contrast flow timing and magnitud
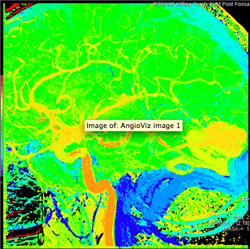
In one image, AngioViz can show peak pixel density value over an image series. This can indicate relative contrast density and d
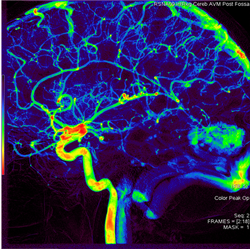
AngioViz can show the time that each pixel reaches peak density on a color coded time scale. This helps indicate contrast flow t
It can be time consuming and laborious to try to determine dynamic information by viewing images available from DSA over and ove
June 14, 2011 – The U.S. Food and Drug Administration (FDA) has given clearance to AngioViz, a GE Healthcare application that gives doctors a new visualization of vascular flow on a single image to help them make important decisions during complex interventional radiology procedures. AngioViz yields its information from digital subtraction angiography (DSA), a technique commonly used to show the vascular anatomy.
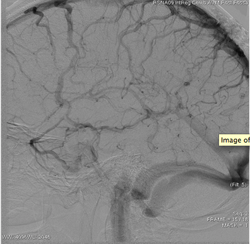
Vascular imaging was revolutionized in the 1980s with the development of DSA. The technique involves injecting a contrast dye into the vascular network while taking a rapid series of X-ray images. The first image, taken before the dye arrives in the field of view, is made into a mask image that is digitally removed, or “subtracted,” from the images showing contrast. The resulting images, which show only the contrast in the vessels, are used to display a 2-D view of the vessels. Because the contrast is traveling through the vessels with the flow of blood, the arteries, capillary circulation, and then the veins are imaged in a DSA series. When used with today’s modern digital flat panel X-ray detectors, DSA produces excellent images of vascular anatomy over time.
But the anatomy of the vessels is only part of the story. Doctors want more information about the patterns and amount of blood flow to make better decisions during image guided interventions. They also want sequential information on a single image, instead of having to scan through a series of DSA images over and over. Finally, they want to see how the flow of blood to an area of tissue has changed as a result of treatment.
A New Visualization of Vascular Flow
AngioViz provides a new visualization of the vascular flow seen in DSA imaging, utilizing a technique called parametric imaging. AngioViz looks at each pixel in the image series and determines two things — the peak value of opacification caused by the contrast, and the time it takes for that pixel to reach peak opacification. These two parameters can be displayed as separate images or combined into a single color-coded image that represents parameters of vascular flow. This enables doctors to perceive parameters of flow quickly to support decision-making. In addition, AngioViz allows easy comparison of parametric images from different DSA acquisitions, such as pre- and post-treatment images. This can help physicians understand the impact on flow dynamics of various interventional treatments.
AngioViz bold flow visualization has the potential to be applied to a variety of clinical situations:
· Help see where a blocked artery diminishes blood flow in the brain or other tissue
· Identify the timing and amount of blood flow in abnormal vessel anatomy
· Observe flow in abnormal tissue before and after treatment to support interventional oncology treatment
· Visualize peripheral artery blood flow before and after balloon angioplasty and stenting
For more information: www.gehealthcare.com

 December 23, 2025