May 13, 2013 — GE Healthcare Innova EPVision 2.0, an application that combines information from electrophysiology (EP) recording and live fluoroscopy, and Dose Blueprint, a comprehensive dose management strategy helping clinicians achieve in particular 50 percent dose reduction on Innova IGS single plane angiography systems compared to previous releases.
Innova EPVision 2.0
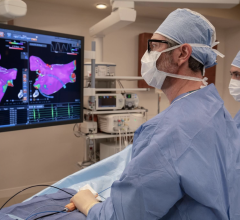
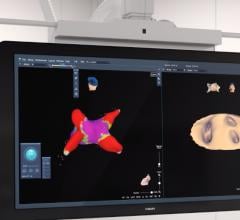
Innova EPVision 2.0 provides live visualization of anatomy and devices during procedures where traditional mapping systems may not be effective for use, or where enhanced visualization is desirable but the additional cost of a mapping procedure may not be justified.
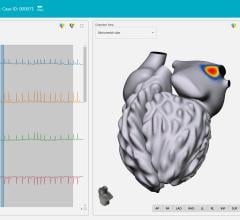
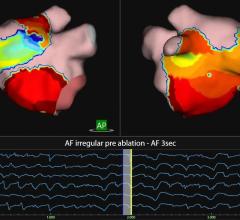
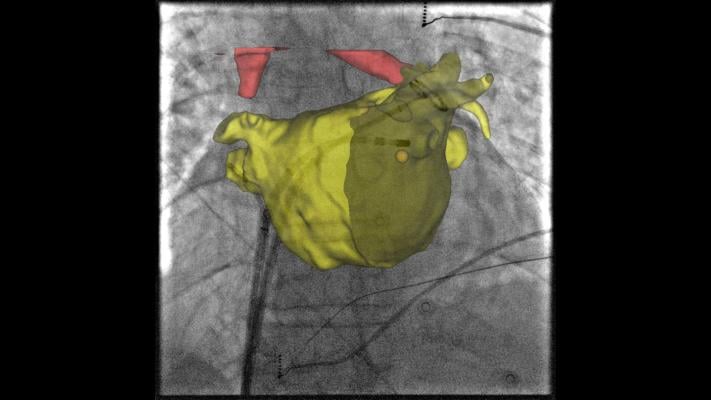
By leveraging the capabilities and outputs available from systems already in the lab, Innova EPVision 2.0 provides enhanced visualization for a wide range of procedures without adding to procedure costs through the use of extra supplies. This innovation enables a new procedure called “Image Guided Point Tagging.” This novel technique fuses cardiac models on live fluoroscopy and color codes them with activation intervals using CardioLab signal data. For GE customers using CardioLab and Innova, this new functionality expands the capabilities and enhances the versatility of systems in the lab.
When a complex EP procedure is performed using emerging technologies such as Cryo-balloon, or Left Atrial appendage devices, traditional mapping systems do not help visualization since impedance-based and magnetic localization systems rely on the presence of EP diagnostic catheters or catheters with magnetic sensor coils. Innova EPVision 2.0 provides accurate visualization of the anatomy and the devices for these procedures where traditional mapping systems may be ineffective.
Additionally, during standard anatomic ablations where anatomic visualization is required without activation mapping, such as pulmonary vein isolations (PVI), Innova EPVision 2.0 provides accurate visualization of anatomy and devices without the need for specialized catheters or patches. If the procedure turns into a study where electroanatomical activation is required, the tool’s Image Guided Point Tagging allows color–coded activation intervals from GE Healthcare’s CardioLab to be tagged on the model, again without the need for specialized supplies.
For procedures such as typical flutters, atrioventricular reciprocating tachycardia (AVRT), atrioventricular nodal reentry tachycardia (AVNRT) and Wolff-Parkinson-White (WPW) procedures, physicians need better visualization of the catheter position, including the ability to tag a spot to return to later. Innova EPVision 2.0 provides enhanced visualization and tagging capabilities not available via fluoroscopy alone.
Dose Blueprint
GE is also advancing the ability for clinicians to manage their dose more effectively during long EP procedures using new features on Innova and with a comprehensive dose-management strategy called the GE Blueprint.
New low-dose imaging include a new lower frame rate that gives users an additional exposure rate option with a 50 percent dose rate reduction compared to previous versions.
With Dose Blueprint, GE brings dose solutions and enables a proactive approach to radiation dose management. Regulating local dose can be a key challenge during interventions, especially in cases like complex ablations and device implants. Dose Blueprint also considers people, processes and the workflow around them.
DoseMap, a recent addition to GE Healthcare’s comprehensive portfolio of dose management solutions, also aims to help address such challenges in complex interventions. With DoseMap, clinicians can visualize cumulated local patient dose throughout the examination. The dose distribution is projected on a patient body model and the resulting dose distribution map is displayed on the reference monitor next to the live image. This empowers the physician with timely dose information without disrupting their procedure workflow.
For more information: www.gehealthcare.com

 September 05, 2025