For more than 20 years, radiation oncologists have emphasized the importance of radiation-tolerant heart rhythm devices for use in patients who require cardiovascular regulation. In the last three years, interest has increased, as medical physicists responded to the U.S. Food and Drug Administration (FDA) to promote investigational research. 1,2 They cite the stability of devices and their effects on radiation beams are without current formalism, since the old Task Group No. 34 published guidance from the American Association of Physicists in Medicine (AAPM) is considered by many to be obsolete in the wake of re-engineered modern device designs. 3
This fact is supported by the recent rise of Task Group No. 203 within the AAPM to revise these 15-year-old recommendations. In the interim, physicians have continued to call for research on the stability of such devices when under irradiation and for guidance on the level of significance in interaction exhibited through dose alteration when these devices are in the prescribed radiation beam. For many radiation oncologists, answers have not come soon enough, although some research has begun. 4,5,6,7
While manufacturers continue to investigate and test devices for functional stability in vitro, research was conducted to provide the information sought by radiation oncologists regarding the change in the radiation beam consequential to having a heart rhythm device remain in it. This is the first publication involving Boston Scientific heart rhythm device effects to radiation beams.
The findings presented here are intended to be a guide for physicians who confide in the computer-modeled radiation therapy treatment plan prior to delivery. It is still recommended that heart rhythm devices not be placed directly in the path of therapeutic radiation. However, in order to test a commercial treatment planning system’s capabilities to model dose at all, these results may be used to assist with the understanding of software limitations and to approximate these physical interactions even when they are out of the field.
Research Materials and Methods Used
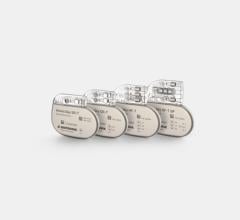
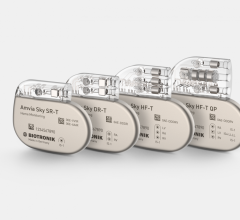
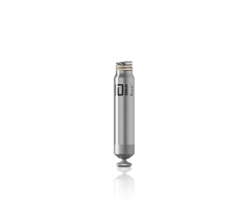
This research is specific to devices currently manufactured by Boston Scientific. They include two implantable cardiac pacemakers (ICP), an implantable cardioverter-defibrillator (ICD), an implantable cardiac resynchronization therapy defibrillator (CRT-D) and associated electrical leads.
The dimensions of the devices vary significantly. The largest is the Cognis CRT-D at 6.17 × 7.95 cm2 with a 9.9 mm thickness. Slightly smaller is the Teligen ICD at 6.17 × 7.95 cm2 with a 9.9 mm thickness. The Altrua 60 EL ICP has dimensions of 4.9 × 4.3 cm2 with an 8 mm thickness. The smallest device is the Altrua 60 ICP, with dimensions of 4.4 × 4.2 cm2 and 8 mm thick.
Figure 1, below, provides a scaled illustration of each. In order to model the dose in a treatment planning system, a water phantom was used to represent a patient undergoing a computerized tomography (CT) scan. A CNMC WP-3040 water phantom was positioned on the couch of the scanner and filled to a depth of 11 cm with an 8 cm acrylic platform positioned inside, so the resulting water depth to the platform was 3 cm. Each device was consecutively submerged and affixed to the platform with electrode leads attached.
The orientation for each heart rhythm device is rotationally centered, with the port connections superior, and turned such that electrodes connect to it from a prone patient’s right side. This stated orientation is identical to what’s shown in Figure 1 and referred to in this article.
For the first scan, the Altrua 60 EL ICP was connected superiorly at the IS-1(RA) port with the AS Fineline II Sterox EZ endocardial pacing lead model 4469, and at the second IS-1(RA) port inferiorly with the Fineline II Sterox endocardial lead model 4457. The second scan included the Altrua ICP 60 with the same leads identically connected. The third scan incorporated the Teligen ICD connected superiorly to DF-1(-), DF-1(+) and IS-1(RV) ports with the Endotak Reliance G defibrillation lead model 0185 and also at the IS-1(RA) connection centrally with the Fineline II Sterox endocardial lead 4457.
For the last scan, the Cognis CRT-D was connected at the DF-1(-), DF-1(+) and IS-1(RV) ports to the Endotak Reliance G defibrillation lead model 0185, then at the IS-1(RA) connection centrally with the Fineline II Sterox endocardial lead 4457, and finally at the (LV) port with the LD CV Acuity Spiral UP model 4593 FD. These connections accurately represent the connections made by vascular physicians on the day of implantation.
A GE LightSpeed RT scanner provided the CT acquisition data. Scanning commenced following the programming of a stereotactic radiosurgery protocol. A total of four helical scans were conducted, with an average technique of 120 kVp and 280 mA and with 1.25 mm couch increments. The largest field of view at 50 cm was utilized. An extended Hounsfield unit (HU) range was required, since inaccurate HU representation for metals within devices can lead to very inaccurate dose simulation results through computer modeling. 4,8,9
After scanning acquisition was complete, all four scan sets, including one per heart rhythm device, was networked to treatment planning computers. Simulation contouring from these CT data was done using Varian’s Eclipse treatment planning system 8.6. Data streaking artifacts exhibited from metals in the device were negated first using existing knowledge of the dimensions of the devices. Boolean operation permitted the assignment of all phantom volume outside of the device contour to have unit density (0 HU).
A single anterior field was assigned to pass through the center of the device in each of the four identically created plans. The beam target position was at the center of the device volume. Although the Boolean operator was used to remove illusory scatter contributions from artifacts around the device, scatter from the device to all points of interest remain important. It was therefore necessary to ensure that the calculation point was placed at a considerable distance from the device, yet still deep enough to reflect adequate buildup. T
he chosen position for the prescription point was at 7 cm off-axis in both directions and under 2.5 cm water depth. The prescription for calculation was for the reference point to receive 10 Gy at 4 Gy/min in a single radiation delivery. Ideal properties of flatness and symmetry within the beam were ensured, as the radiation field was defined by 30 × 30 cm2 jaw collimation.
The algorithm for dose calculation was the Varian Anisotropic Analytical Algorithm (AAA) version 8.6.15. It incorporates ionization chamber measured data from a Varian 21EX high-energy particle accelerator capable of emitting bramsstrählung photon energies of 6 MV and 18 MV. The particle accelerator was calibrated for an output of 0.01 Gy per monitor unit at the center of rotation of the machine in a 10 × 10 cm2 field size.10
The water depth providing maximum dose was nominally 1.5 cm at 6 MV and 2.5 cm at 18 MV. Varian scaling geometry was used, where the gantry angle, couch angle and collimator were each at 180 degrees. The smallest possible grid size of 0.1 mm was assigned. In each of the four identical dose simulation plans specific to each device studied, the algorithm was programmed to present results while considering the various interpreted densities within each heart rhythm device. The resulting 3-D distribution of dose absorbed by the phantom medium is shown in separate views of the software.
Dose calculation points were strategically placed where the highest dose gradient lines were observed in each plane independently for each device plan. Figure 2 illustrates the simulated dose calculation results.
Dose points were placed along electrodes of each lead at a distance of 0.3 cm both anterior and posterior on CT scans. Posterior to the bulky generator device, points were placed at 1 cm and 2 cm away. Laterally and superiorly, dose calculation points were positioned 0.5 cm away. It was expected that photon fluence would decrease significantly in passing through the metallic devices, but that dose would be seen to increase slightly laterally and anterior, due to back-scattering.
Following calculation point placement, the computer was reprogrammed to assume water density for everything. This was a tactic employed to view baseline results as if the heart rhythm device were not actually in the beam. The ratio of results between the heterogeneous and homogeneous density plans yields the overall effect of the device on the radiation absorbed dose distribution. The analysis method is consistent with published recommendations of AAPM Task Group No. 63 for simulating dose involving high atomic number materials. 11
Treatment planning system results were verified by direct ionization measurements. Measurement geometry was performed identically to that of the CT acquisition and planning. Point radiation measurements were conducted using a PTW New York thimble-type ionization chamber with 0.015cm3 sensitive volume. The “pin-point” chamber was connected to a CNMC 206 electrometer having a 200 nC feedback module, model 206-110. For all measurements, a nominal potential of +300 V to the center-pin was maintained.
The chamber was submerged in the water phantom and affixed using medical tape at the various anterior and lateral locations observed by treatment planning to be high-dose change areas of interest for the device under investigation. For homogeneous measurement comparisons, the device and electrodes were entirely removed, with the chamber repositioned to the same point as before with the assistance of a rubber bolus material. Measurements were made at locations identical to the position of calculation points used for treatment planning. The chamber was positioned along electrodes of each lead at a distance of 0.3 cm both anterior and posterior.
Laterally and superiorly, dose measurements were achieved 0.5 cm away. The phantom used for attenuation measurements was a homemade, plastic phantom with a square area of 30 × 30 cm2, base thickness of 0.3 mm and height of 12.5 cm. Water was added as before, resulting in a 3 cm water depth. This phantom geometry permitted radiation measurements to be acquired using a Sun Nuclear MapCheck diode array with software version 5.00.00. The detector system included 445 diodes embedded in a water-equivalent plastic at a depth of 2 cm beneath the surface in a plane 22 × 22 cm2 in area.
Radiation dose measurements were taken posterior to the bulky generator device at 2 cm away, as used in planning. Measurements were then made without the heart rhythm device included. The software can plot the dose from two plans in any one particular plane. Where isodose distribution changes are seen to exist for the beam profiles between heterogeneous and homogeneous plans, a resulting subtraction plot makes known all notable shifts in dose between measurement with and without heart rhythm devices submerged. This gives rise to the effect of a device being present in the radiation beam. Radiation measurement results were then correlated with treatment planning system simulations. 4,11,12
Attenuation Changes
Dose gradients were easily identifiable through the simulation process, shown in Figure 2. Calculation points of interest were decidedly placed at locations where the highest dose gradients exist.
For generators, back-scatter and side-scatter measurements were not observed through simulation, but both were measured at small levels from ionization chamber measurements. Less than 1.1% side-scatter was seen for all generator types. Back-scatter was determined to be of less consequence, resulting in findings on the order of 0.8%. Attenuation was notably identifiable in simulation methods and through measurement. Table 1 shows results for each device at 6 MV and 18 MV photon energies.
Agreement between the two methods was determined to be within +2.9%. The average disagreement for all generators was +1.6% at 6 MV and +1.7% at 18 MV. In all cases, except for the results of the Altrua 60 EL ICP, simulation results were underestimated as compared to measured changes. However, the least amount of disagreement was determined in this case at -0.8%.
Markedly, all attenuation results were found to be less than -8.4% by measurement. The Altrua 60 EL and Altrua 60 ICPs exhibited less dose change effect than the Teligen ICD and the Cognis CRT-D device at both energies, with the exception of the 18 MV result for the Teligen. For all devices without exception, attenuation was found to decrease with increasing photon energy, by simulation as well as measurement. 4
All leads exhibited dose changes through simulation and measured nearly identically. No back-scatter or side-scatter was observed in either case. However, each lead caused an effect of dose disturbance by attenuation up to 2.5%. The maximum dose difference seen for the port connectors reflected dose changes of small magnitude as well. The maximum dose change observed in all cases was 3.1% for electrode leads.
Additional Observations
It was expected the photon beam would interact with the metal electronics and casing within each heart rhythm device. But it was important to understand the level of interaction exhibited by each. Inspection of the internal structure of the devices revealed a consistent pattern of dose change behavior - the greater the density of the material in a sizable area, the greater the dose change effect exhibited.
Assisted by CT scan images, the more dense areas within these devices were color-coded and can be seen in the Figure 3 illustration. Both ICPs are similar in construction and in their effects on the distribution of dose in water. The greater density locations within these devices are mostly located on the right side and inferior (Figures 2 and 3).
The pacemaker contains a highly dense lithium iodine battery encased in stainless steel and titanium, taking up half of its total volume. The battery takes up nearly the entire inferior volume of the device. This is consistent with the large change isodose shift observed from simulation (shown in Figure 2, D) being dominantly superior.
Some attenuation was observed in the simulated dose plots inferior. This region contains the bulk of the pacemaker’s electronics. To a much less degree of change with respect to the inferiorly located battery, the largest of changes from this superior region appear to be from the centrally located copper. Change was also noted from the location of the ceramic platinum-sandwiched capacitor arrays. This is also observed in Figure 2, D, as superiorly located, rippled isodose gradients.
The Teligen ICD and the Cognis CRT-D are very different in construction compared to the ICPs. But the two defibrillator types have comparable designs and dose change effects with each other (Figures 2 and 3). They both have a stack of two high-voltage titanium-surrounded capacitors in the inferior left side of the device, taking up about one-fourth of the total volume.
Next to the capacitor stack, right-sided and taking up about another one-fourth of the volume, is the generator battery. It is comprised largely of manganese dioxide with 5% nickel, all enveloped in a grade 316L stainless steel casing. The highly dense inferior region containing the capacitors and battery caused the largest shift in isodose distribution, as in Figure 2, B. There also was a pronounced step-like shift in the dose distribution from right to left. The variation in attenuation was caused by the right side having greater density than the left.
With manganese and nickel present in the battery, a higher effective atomic number for it caused more radiation blocking. Superior attenuation locations were noted to be caused by various small electronic components present. These include a strip of tantalum capacitors, a round high-voltage transformer with a copper coil, a block of ceramic capacitors made of barium titanate and an externally positioned radiofrequency antenna wire made of platinum-irridium.
The effects caused by these electronic components were identified in Figure 2, C, as jagged dose changes. Generator leads were made with identical stainless steel port connectors. The electrodes were mainly platinum-irridium. Although there was some difference seen in the spacing and length of electrodes, each lead model generally had little effect on the 6 MV and 18 MV photon beams.
In conclusion, agreement between simulation and radiation measurement was determined to be within +2.9%. The average disagreement for all generators was +1.7% at 6 MV and 18 MV. In general, simulation results underestimated dose gradients in comparison to radiation measurements. For generators, back-scatter and side-scatter measurements were not observed through simulation, although measured at small levels to less than +1.1%. All attenuation results were found to be within -8.4% for generators.
ICPs tended to cause less dose change affect than the ICD or the CRT-D. Attenuation was noted to decrease with increasing photon energy. Marginally significant attenuation dose changes were observed only for electrode leads and connector ports, at less than 3.1% for all types studied here.
Michael S. Gossman, M.S., DABR, is chief medical physicist and RSO, Tri-State Regional Cancer Center, Medical Physics Section, Ashland, Ky. His research was supported by the issuance of Boston Scientific Grant #BSC-3301.
TABLE 1 Table 1 shows attenuation results for all heart rhythm generators at both photon energies, according to simulation and measurement.
Attenuation Dose Changes Observed 6 MV X-rays ---- 18 MV X-rays Model -- Device Type -- Simulation -- Measurement -- Simulation -- Measurement Altrua 60 EL -- ICP -- -7.2% -- -6.4% -- -4.4% -- -5.2% Altrua 60 -- ICP -- -5.8% -- -7.3% -- -3.4% -- -5.2% Teligen -- ICD -- -5.2% -- -7.8% -- -2.8% -- -4.5% Cognis -- CRT-D -- -5.5% -- -8.4% -- -3.0% -- -5.5%
References: 1 U.S. Food and Drug Administration, Center for Devices and Radiological Health. “FDA preliminary public health notification: possible malfunction of electronic medical devices caused by computed tomography (CT) scanning.” www/fda/gov/cdrh/safety/071408-ctscanning.html (2008).
2 White GA. Letter to the U.S. FDA, Center for Devices and Radiological Health. April 21, 2008.
3 Marbach JR, Sontag MR, Van Dyk J, Wolbarst AB. “AAPM Report No. 45 (TG-34) - Management of radiation oncology patients with implanted cardiac pacemakers.” Med Phys, 1994; 21:85-90.
4 Gossman MS, Graves-Calhoun AR, Wilkinson JD. “Establishing radiation therapy treatment planning effects involving implantable pacemakers and implantable cardioverter-defibrillators.” J Appl Clin Med Phys, 2010; 11(1):1-13.
5 McCollough CH, Zhang J, Primak AN, et al. “Effects of CT irradiation on implantable cardiac rhythm management devices.” Radiol, 2007; 243:766-774.
6 Yamaji A, Imai S, Saito F, et al. “Does high-power computer tomography scanning equipment affect the operation of pacemakers?” Circulation J, 2006; 70:190-197.
7 Hurkmans C, Scheepers E, et al. “Influence of radiotherapy on the latest generation of implantable cardioverter-defibrillators.” Int J Radiat Oncol Biol Phys, 2005; 63:282-289.
8 Coolens C, Childs PJ. “Calibration of CT Hounsfield units for radiotherapy treatment planning of patients with metallic hip prostheses: use of the extended CT-scale.” Phys Med Biol, 2003; 48:1591-1603.
9 Gossman MS, Seuntjens JP, Christian KJ, Serban MM, Lawson RC, Robertson MA, Lopez JP, Justice TE. “Dosimetric effects near implanted vascular access ports: an examination of external photon beam dose calculations.” J Appl Clin Med Phys, 2009; 10(3):3-15.
10 Almond PR, Biggs PJ, Coursey BM, et al. “AAPM’s TG-51 protocol for clinical reference dosimetry of high-energy photon and electron beams.” Med Phys, 1999; 26:1847-1870.
11 Reft C, Alecu R, Das IJ, Gerbi BJ, et al. “Dosimetric considerations for patients with HIP prosthetics undergoing pelvis irradiation - Report of the AAPM Radiation Therapy Committee Task Group 63.” Med Phys, 2003; 30:1162-1182.
12 Van Dyk J, Barnett RB, Cygler JE, Shragge PC. “Commissioning and quality assurance of treatment planning computers.” Int J Radiat Oncol Biol Phys, 1993; 26(2):261-73.


 April 24, 2026