Jan. 20, 2026 — Polarean, a commercial-stage medical imaging company advancing functional MRI of the lungs, has expanded its Xenon MRI platform into cardiopulmonary pharma-sponsored drug development ...
Magnetic Resonance Imaging (MRI)
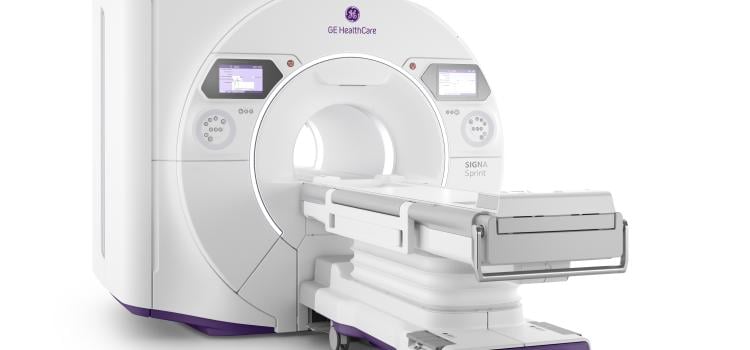
Cardiac MRI creates images from the resonance of hydrogen atoms when they are polarized to face in one direction and then hit with an electromagnetic pulse to knock them off axis. The wobbling of the atoms is what is recorded by computers and used to reconstruct the images. Cardiac MR allows very detailed visualization of the myocardial tissue above the resolution found with cardiac CT. Using different protocol sequences, various contrast type images can be created with MRI to enhance various tissues or to provide physiological data on the function of the heart. This section includes MR analysis software, MRI scanners, gadolinium contrast agents, and related magnetic resonance accessories.
Jan. 20, 2026 — Polarean, a commercial-stage medical imaging company advancing functional MRI of the lungs, has expanded ...
Oct. 28, 2025 — Bronchopulmonary dysplasia (BPD) is the most common — and most serious — complication of extreme ...
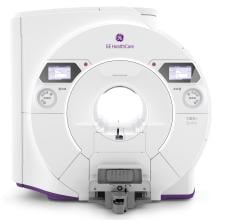
May 12, 2025 — GE HealthCare recently unveiled Signa Sprint, an FDA 510(k) pending[1] ultra-premium wide bore 1.5T high ...
As medical advancements continue to push the boundaries of what is possible in the field of structural heart ...
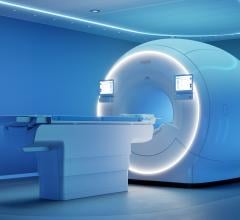
Nov. 21, 2024 — Royal Philips plans to unveil its next-generation 1.5T BlueSeal MR wide-bore scanner at RSNA 2024 in ...
July 12, 2024 — Researchers have developed a groundbreaking method for analyzing heart MRI scans with the help of artifi ...
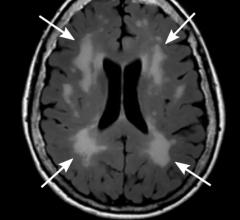
May 7, 2024 — A new study by a global team of researchers, led by Sook-Lei Liew, PhD, of USC's Mark and Mary Stevens ...
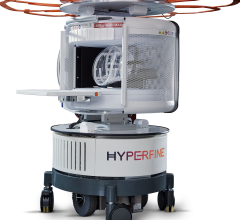
February 21, 2024 — Hyperfine, Inc., a groundbreaking health technology company that has redefined brain imaging with ...
February 12, 2024 — According to the American Journal of Roentgenology (AJR), free-breathing cine-deep learning (DL) may ...
December 19, 2023 — A vest that can map the electrical activity of the heart in fine detail could potentially be used to ...
November 21, 2023 — Heuron, a medical AI (artificial intelligence) imaging software solution company, under the ...
November 17, 2023 — Researchers from the University of Minnesota Medical School examining the cause of cardiomyopathy ...
November 3, 2023 — In the U.S., someone has a stroke every 40 seconds and dies from it every three minutes and 14 ...
August 24, 2023 —Royal Philips, a global leader in health technology, highlighted how it integrates AI in cardiac ...
As medical advancements continue to push the boundaries of what is possible in the field of structural heart ...


 January 21, 2026

