April 21, 2026 — At HRS 2026, Johnson & Johnson will launch the Cartosound Sonata Module, leveraging artificial intelligence with the Carto System to automatically transform intracardiac ...
EP Mapping and Imaging Systems
This channel page contains news on new technology innovations for electrophysiology (EP) mapping and imaging systems used to guide transcatheter cardiac ablation procedures. These systems use mapping catheters that contain electrodes that measure the electrical activity of the cardiac tissue. This is transferred into mapping system software where a 3D model is created of the heart, a color-coded overlay showing the electrical waves generated during each heart beat, the touch points where the tissue was mapped, and showing the location of the catheter inside the heart. Tissue identified as having unhealthy electrical activity that is cause an arrhythmia can then be ablated directly or isolated using an ablation catheter to cause small burns/scar tissue that block electrical signals.
-

-

Sept. 2, 2025 — Stereotaxis has announced the successful completion of the world’s first procedures using MAGiC Sweep, a robotically-navigated high-density electrophysiology (EP) mapping catheter. The ...
-

Sept. 3, 2025 — Kardium Inc. recently announced it has received pre-market approval (PMA) for the Globe Pulsed Field System and 510(k) clearance for both the Globe Introducer sheath and the Globe ...
-

May 2, 2023 — The Heart Rhythm Society (HRS) is making final preparations for its Annual Heart Rhythm Meeting, HRS2023, which continues to bring together the largest gathering of heart rhythm ...

April 21, 2026 — At HRS 2026, Johnson & Johnson will launch the Cartosound Sonata Module, leveraging artificial ...
 April 22, 2026
April 17, 2026 — Corify Care has announced that the U.S. Food and Drug Administration (FDA) has granted clearance for ...
April 20, 2026
Jan. 28, 2026 — Corify Care has announced a major development in cardiac electrophysiology with the publication of its ...
January 29, 2026
Sept. 2, 2025 — Stereotaxis has announced the successful completion of the world’s first procedures using MAGiC Sweep, a ...
September 05, 2025
Sept. 3, 2025 — Kardium Inc. recently announced it has received pre-market approval (PMA) for the Globe Pulsed Field ...
September 03, 2025
July 19, 2023 — Stereotaxis, a pioneer and global leader in surgical robotics for minimally invasive endovascular ...
July 19, 2023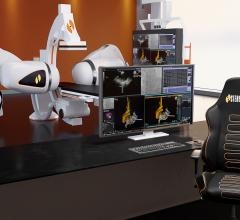
May 24, 2023 — Stereotaxis announced a global collaboration with Abbott to integrate Abbott’s EnSite X EP System with ...
May 24, 2023
May 17, 2023 — Biosense Webster, Inc., a global leader in cardiac arrhythmiatreatment and part of Johnson & Johnson ...
May 17, 2023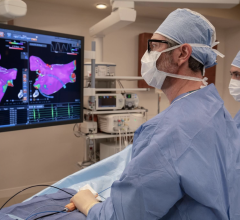
May 15, 2023 — Biosense Webster, Inc., a global leader in cardiac arrhythmia treatment and part of Johnson & Johnson ...
May 15, 2023
May 2, 2023 — The Heart Rhythm Society (HRS) is making final preparations for its Annual Heart Rhythm Meeting, HRS2023 ...
May 02, 2023
December 14, 2022 — Field Medical, Inc. and CardioNXT, Inc. announce a strategic collaboration to provide the first-of ...
December 14, 2022
May 2, 2022 – Johnson & Johnson MedTech have announced that Biosense Webster, Inc., a worldwide leader in the science ...
May 02, 2022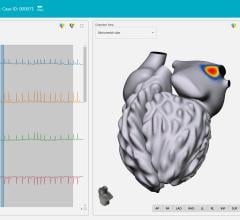
April 29, 2022 – Vektor Medical has announced positive results from its “Vektor vMap Clinical Validation Study” ...
April 29, 2022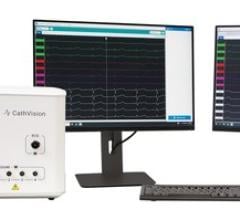
April 27, 2022 – CathVision, a medical technology company developing innovative electrophysiology solutions designed to ...
April 27, 2022
March 3, 2022 – CIRCA Scientific, Inc. has announced that its S-CATH M Esophageal Temperature Probe is now cleared for ...
March 03, 2022